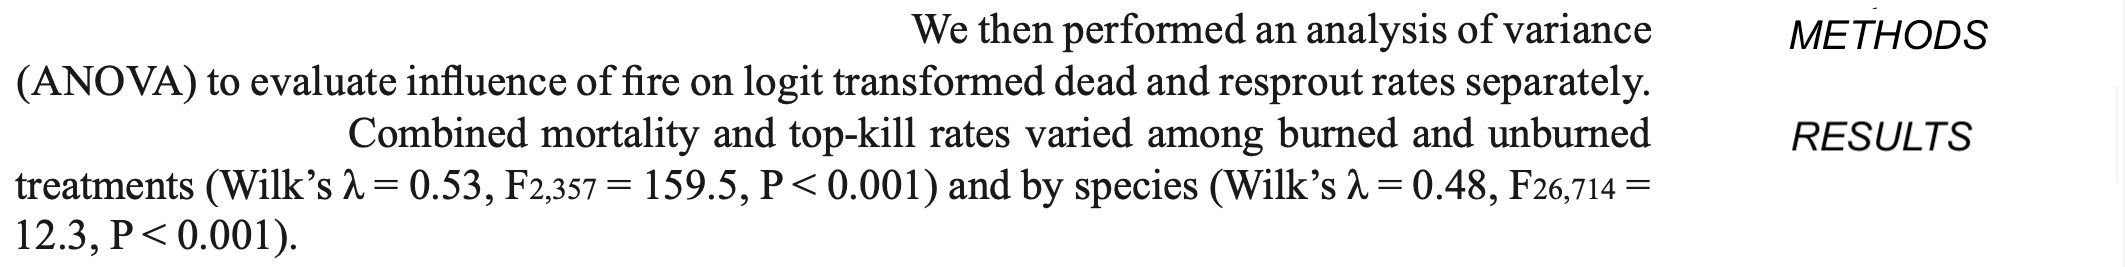
Endangered Species and Postfire Vegetation Surveys
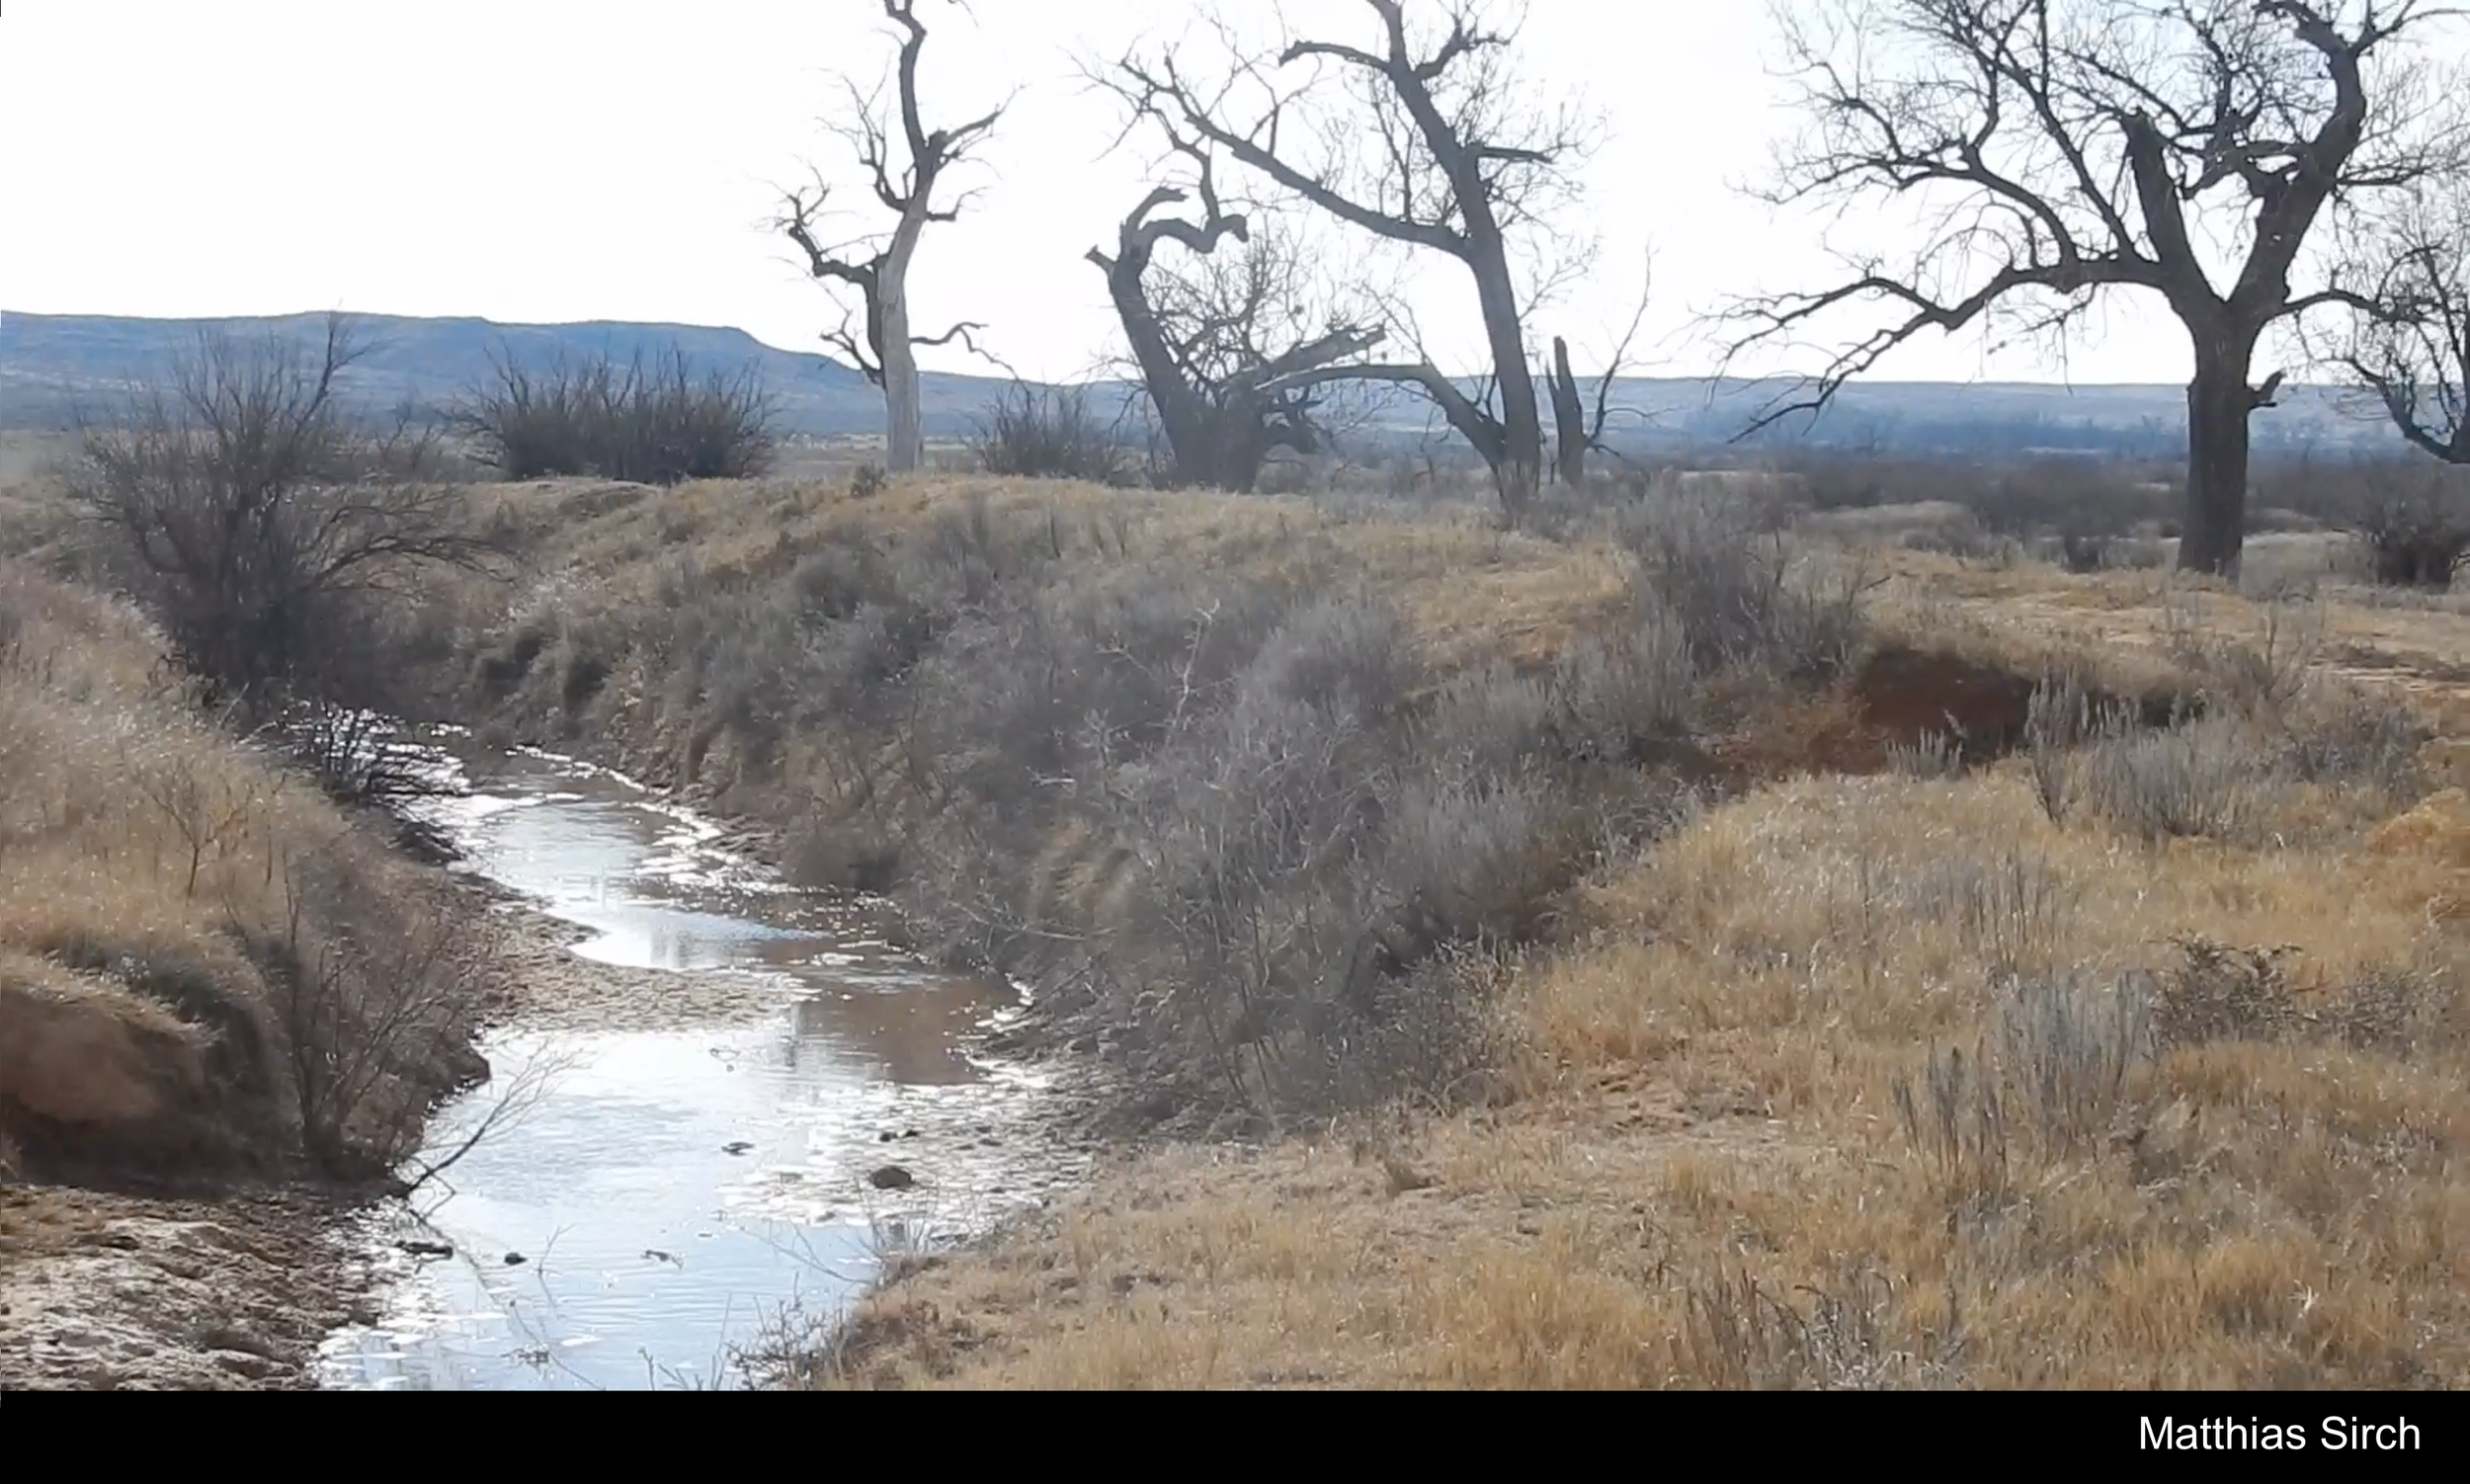
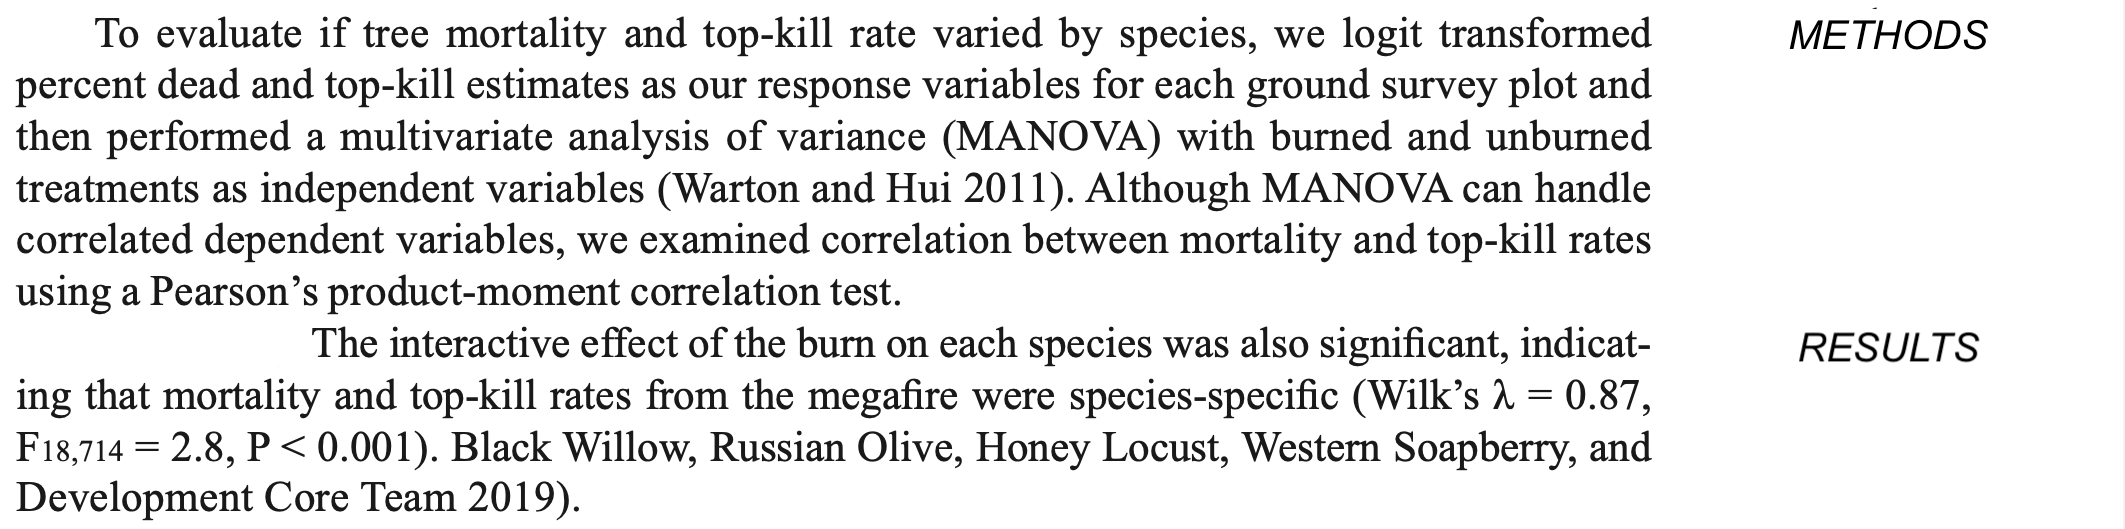
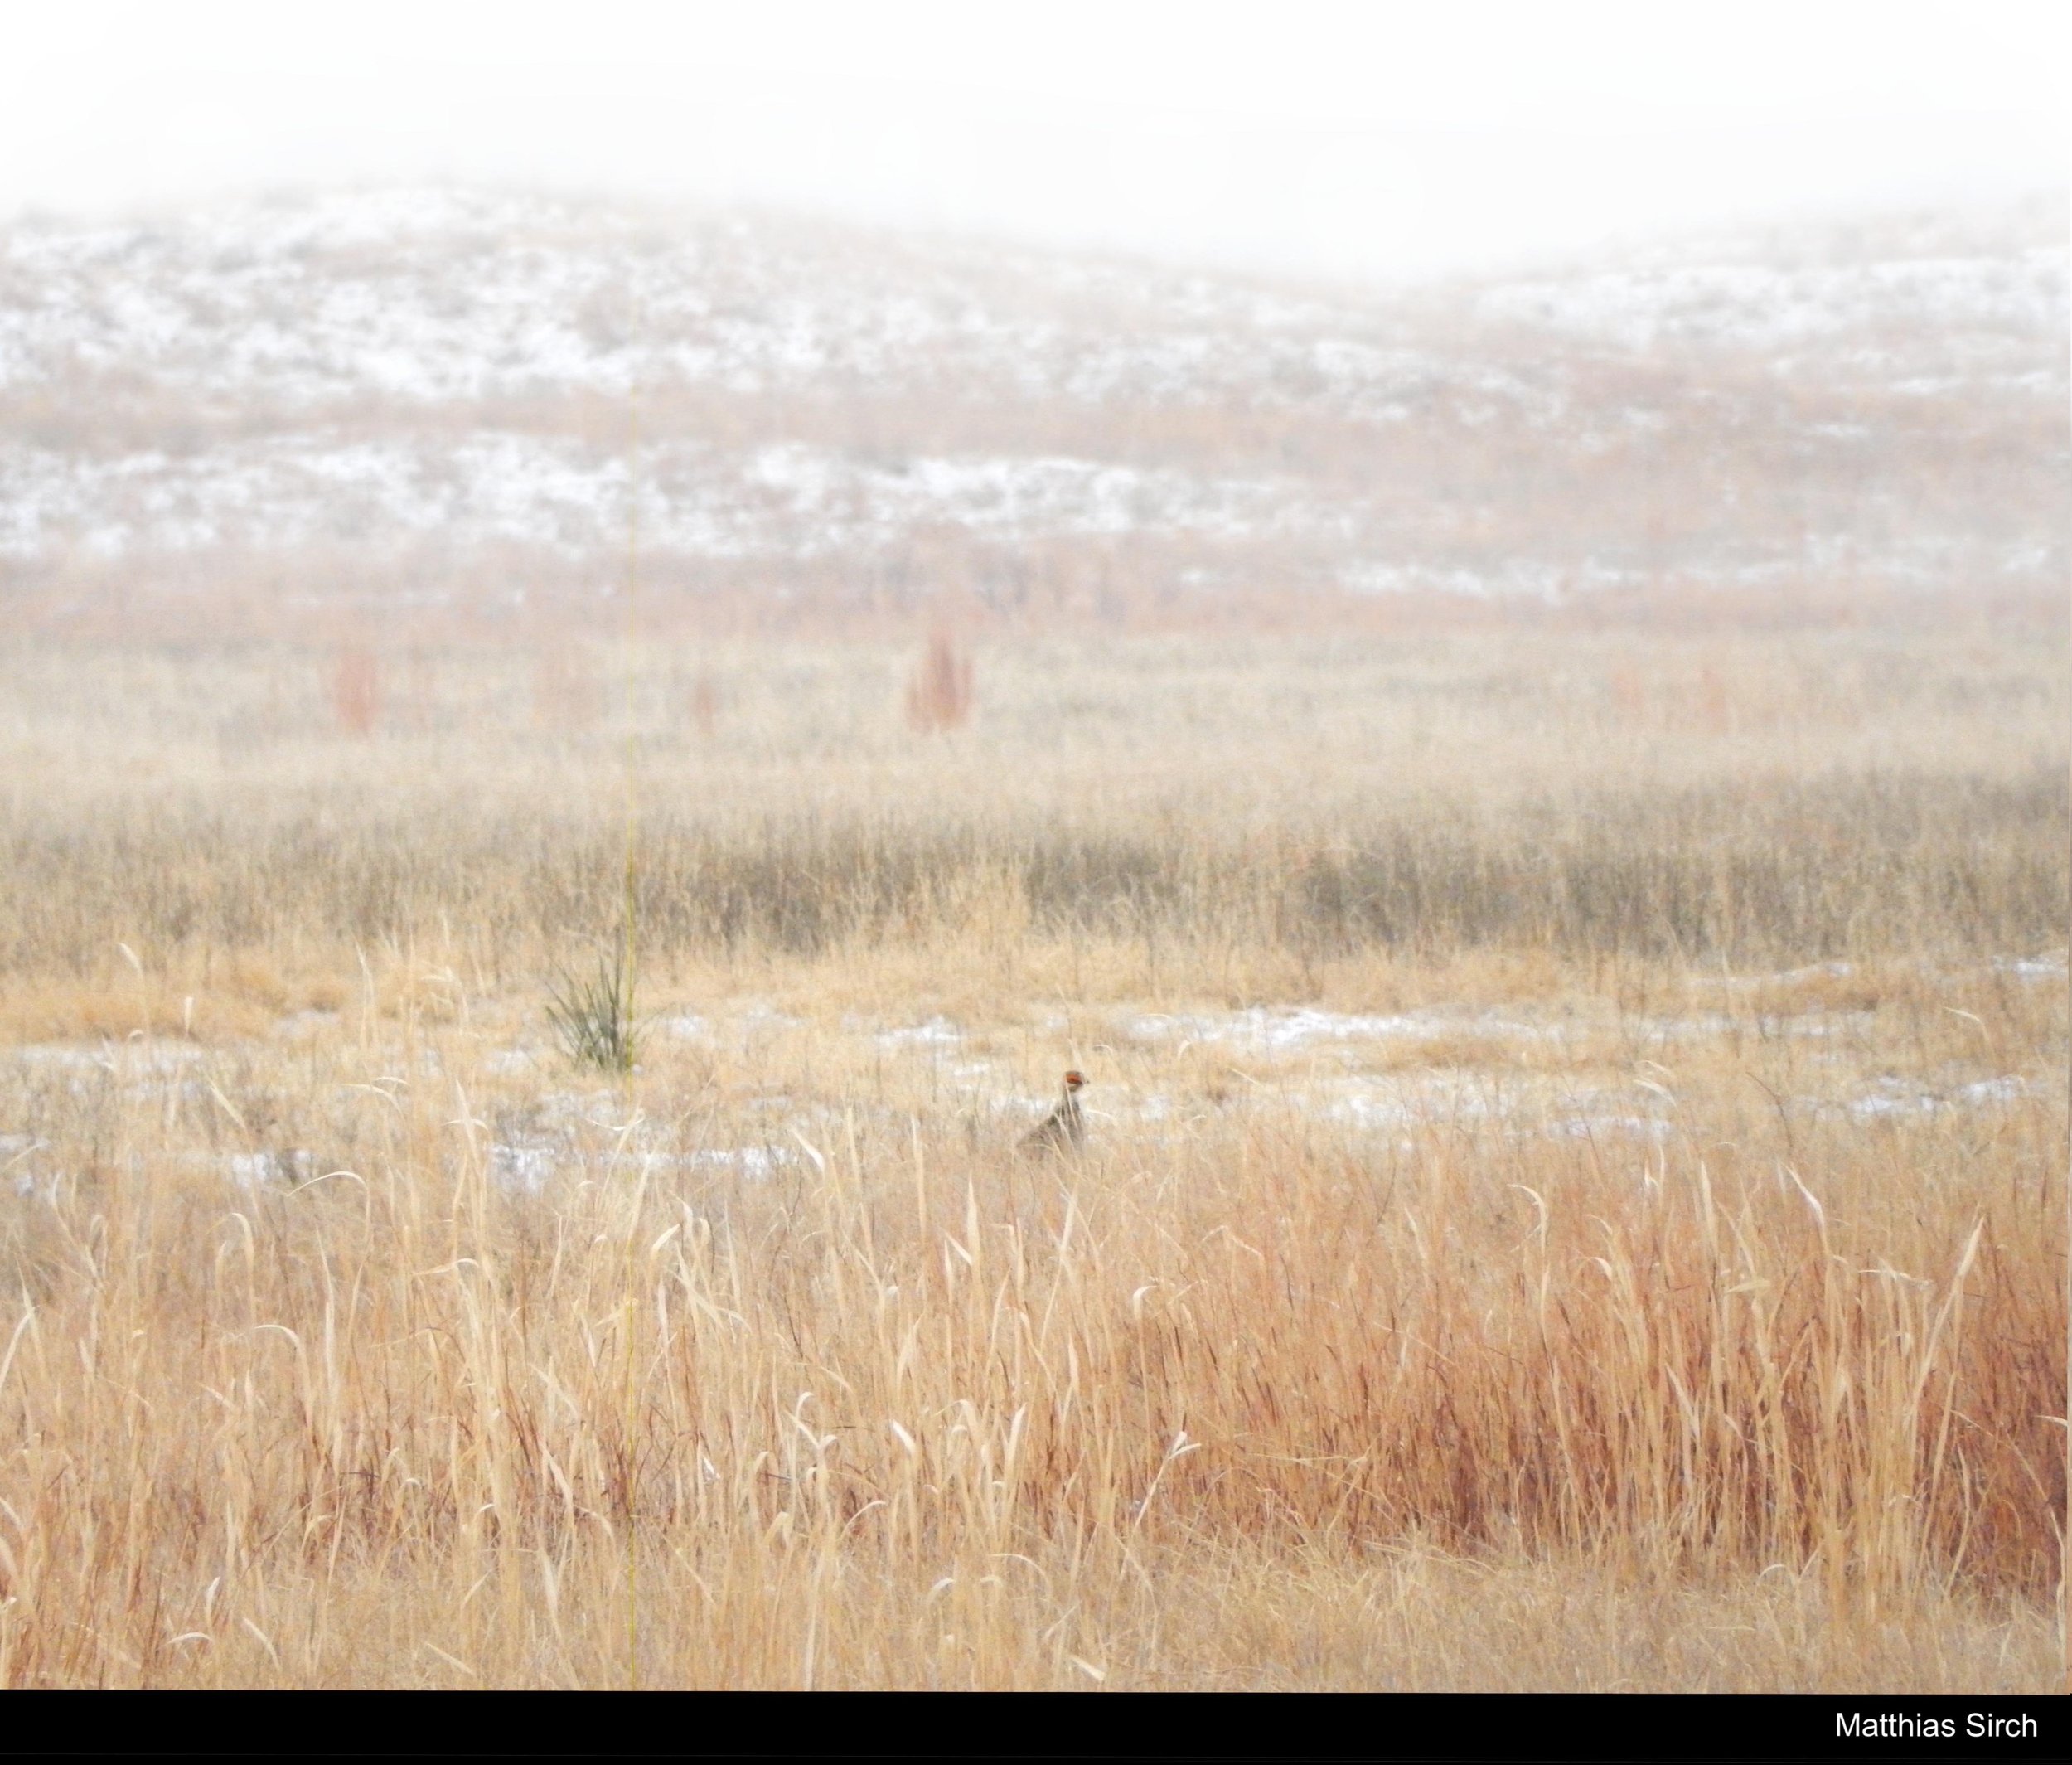
In 2018, I led a field crew in southwestern Kansas to examine the impacts of the Starbuck fire on Lesser Prairie-chickens. While monitoring nest success, I also developed an independent study surveying mortality and post-fire recovery of trees.
I was particularly curious if the fire suppressed colonization of invasive saltcedar.
Delineating saltcedar boundaries
In the false color image below, I set 2015 NAIP bands to the spectral peaks of trained data based on the Random Forest Model (RFM) results. Manually delineated saltcedar boundaries produced plots with species composition of 97 ± 2% saltcedar.
National Agriculture Imagery Program (NAIP) imagery (4 bands, June 2015)
Data
Analyses
randomForest package used in R
1000 random sample points of the NAIP bands within saltcedar, trees, and grassland each
Analysis
GENERALIZED LINEAR MODEL (GLM)
R: glm(y~x, data=df, family="gaussian")
ANALYSIS OF VARIANCE (ANOVA)
R: aov(x~y, data=df)
MULTIVARIATE ANALYSIS OF VARIANCE (MANOVA)
R: manova(cbind(x, y)~z, data=df)
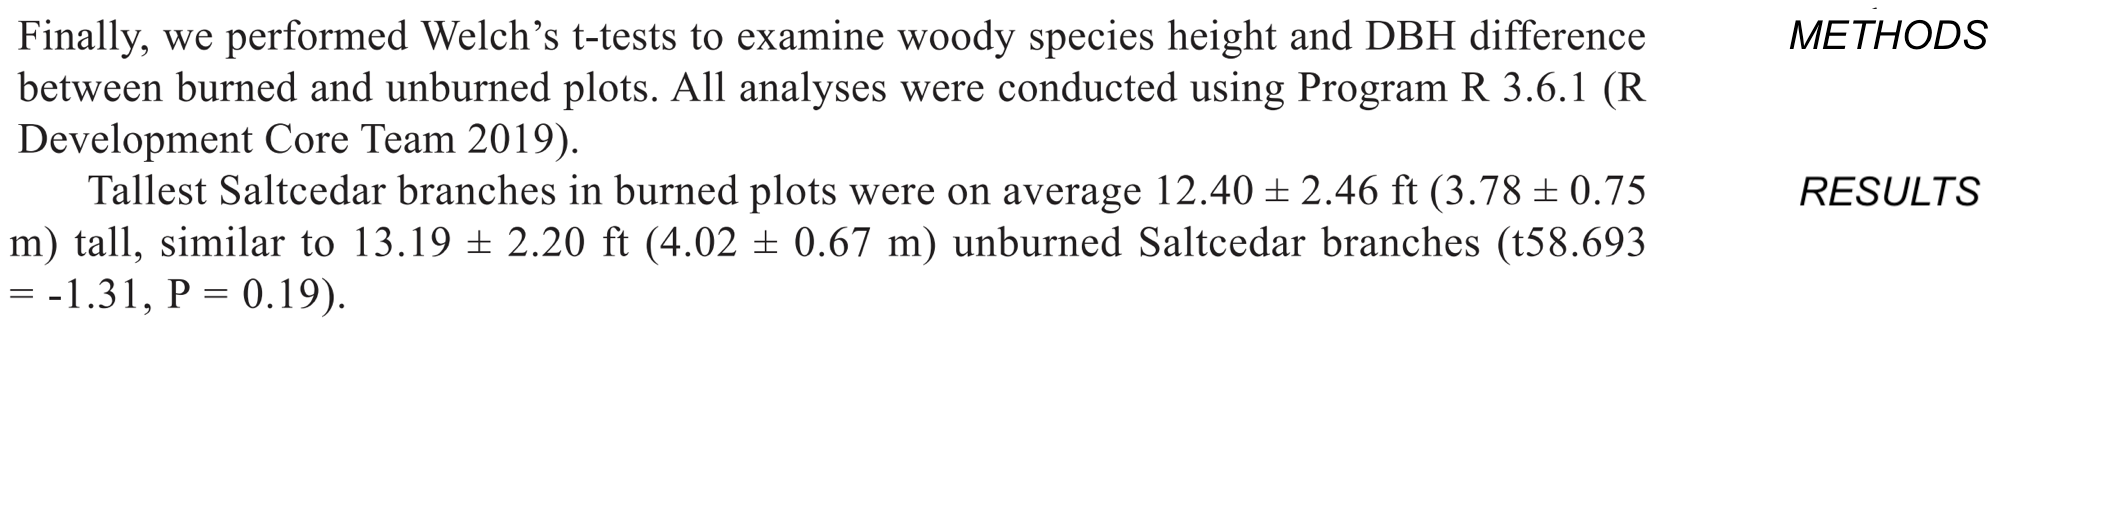
WELCH’S T-TEST
R: t.test(x, y, data=df)
Exploration: Which burn indices or presence/absence of fire at what distance from leks best predicts change in lek counts of lesser-prairie chicken pre- to postfire?
CORRECTED AKAIKE INFORMATION CRITERION (AICc )
Parameters
dNBR and MIRBI burn index (Figure 1) and present/absence (PA) fire values at distances 10-30,000 meters from each lek (n=18).
Leks had an average of 11.86 ± 7.95 SD birds per lek (116 total) before the fire (2015), and 5.44 ± 6.1 birds per lek (45) after the fire (2018).
AIC is corrected for the the very small sample size.
Very large spread in data.
Analysis: AICcmodavg package used in R
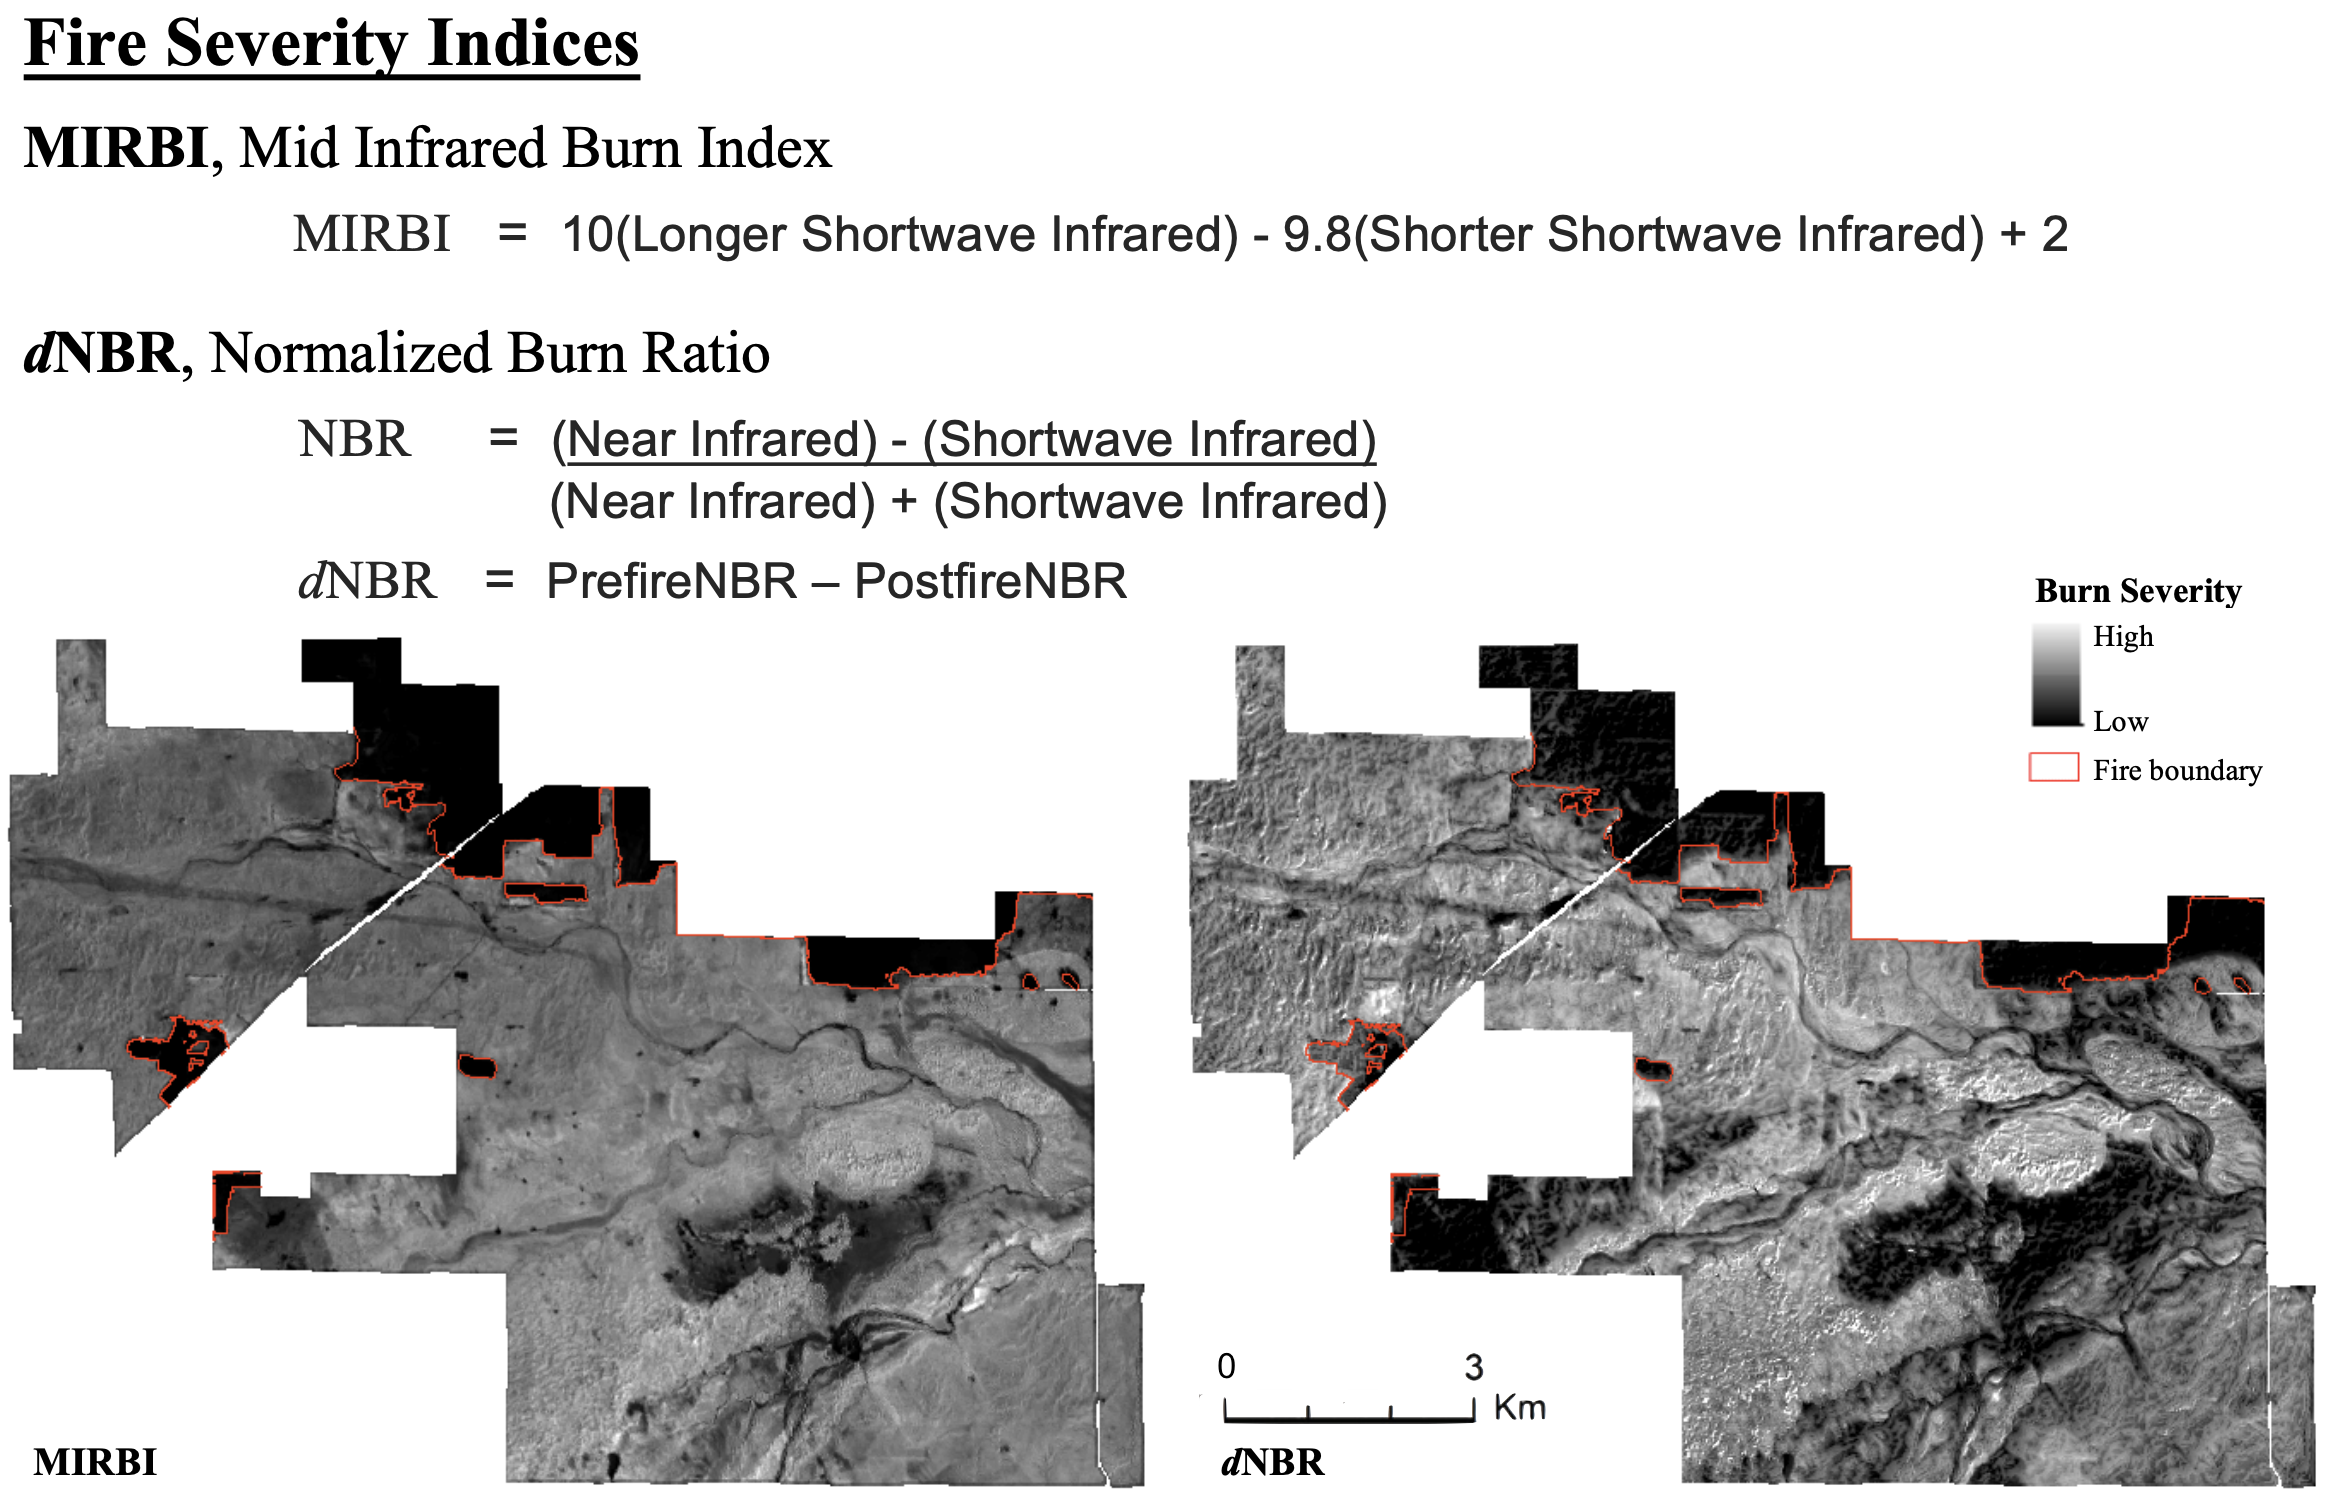
Mid Infrared Burn Index (MIRBI, left) from March 8, 2017, and differenced Normalized Burn Ratio (dNBR, right) from March 1 and 8, 2017, in Clark County, Kansas. Indices were calculated using Landsat 8 imagery accessed from https://earthexplorer.usgs.gov/.
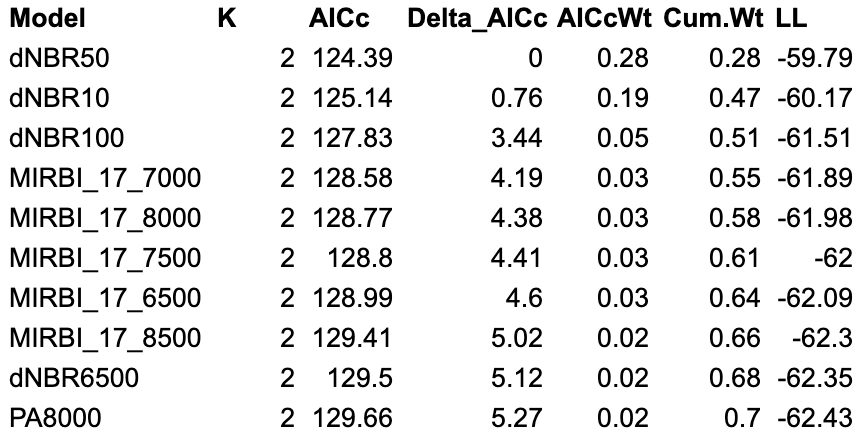
The change in lek counts was best predicted by the differenced Normalized Burn Ratio 50 meters from the lek.
10 Top Models
Generalized Linear Model (GLM)
for change in lek counts against
dNBR values at 50 ft from lek
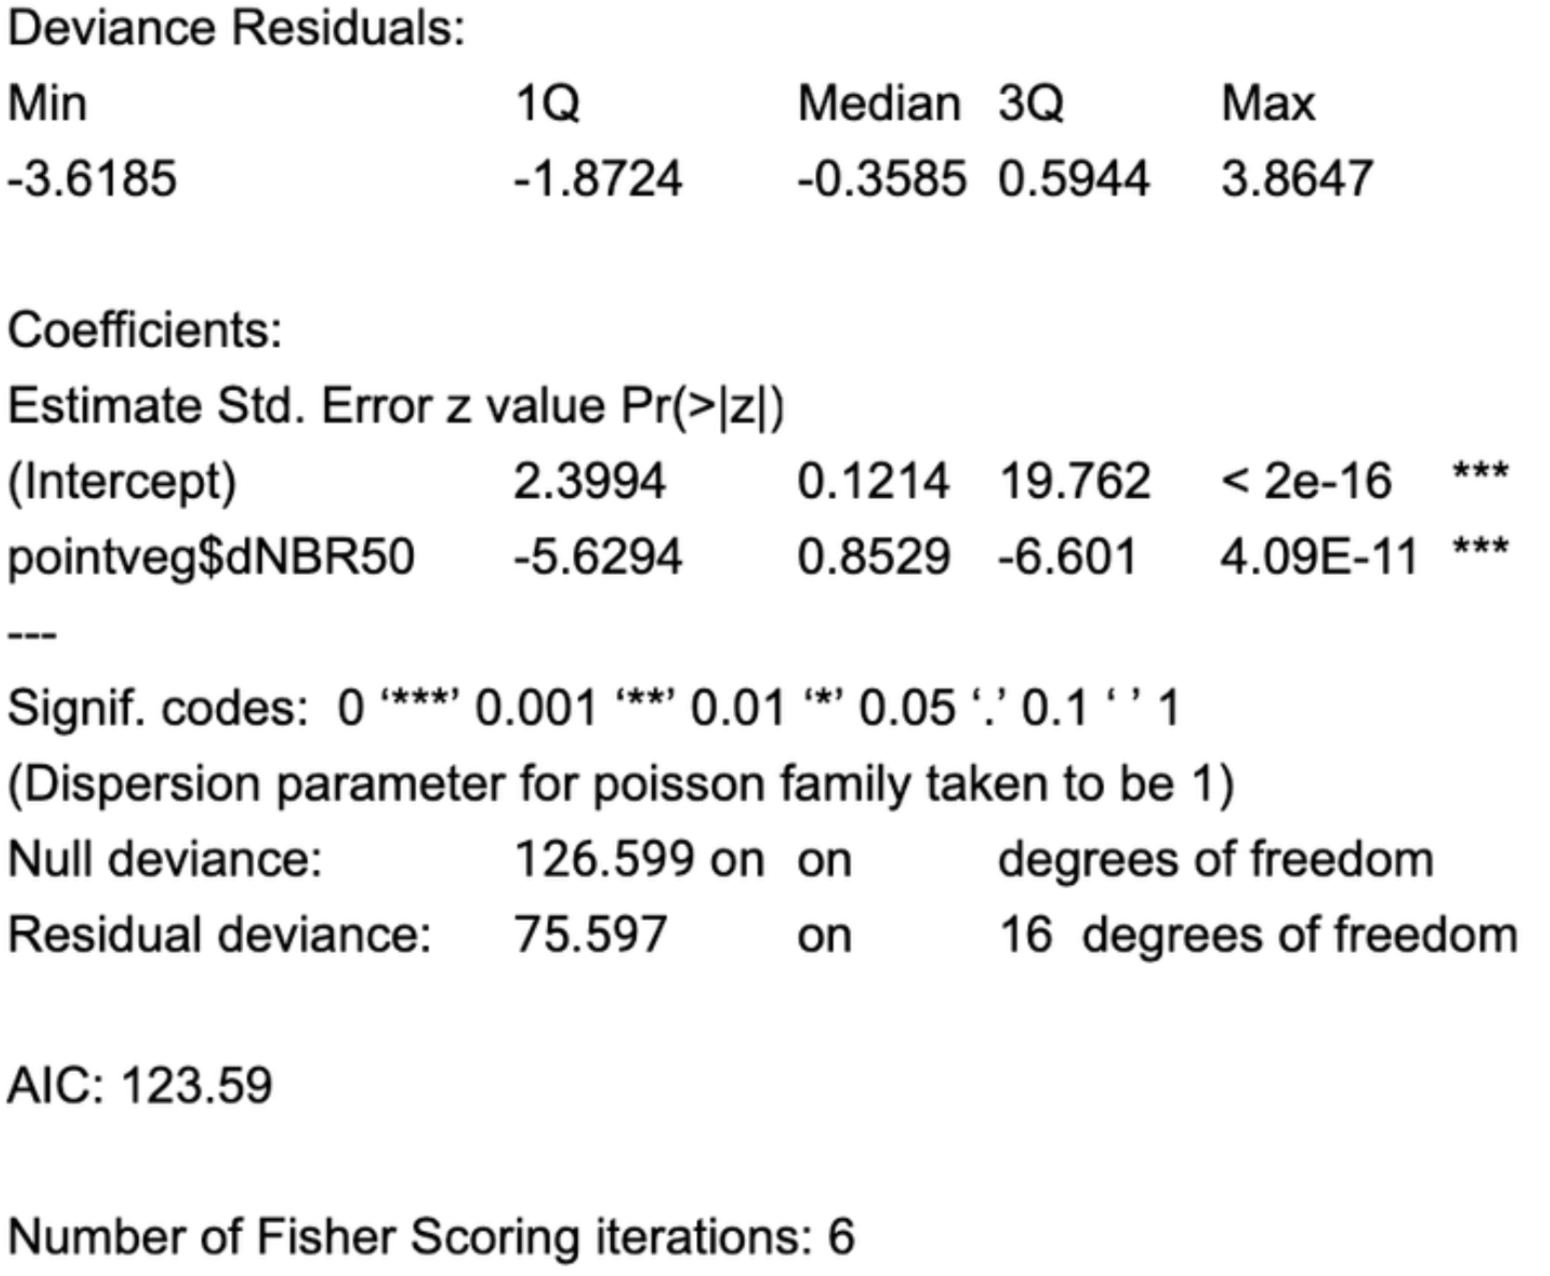
This model is significant, predicting postfire lek count with a standard error of 4.7 chickens!